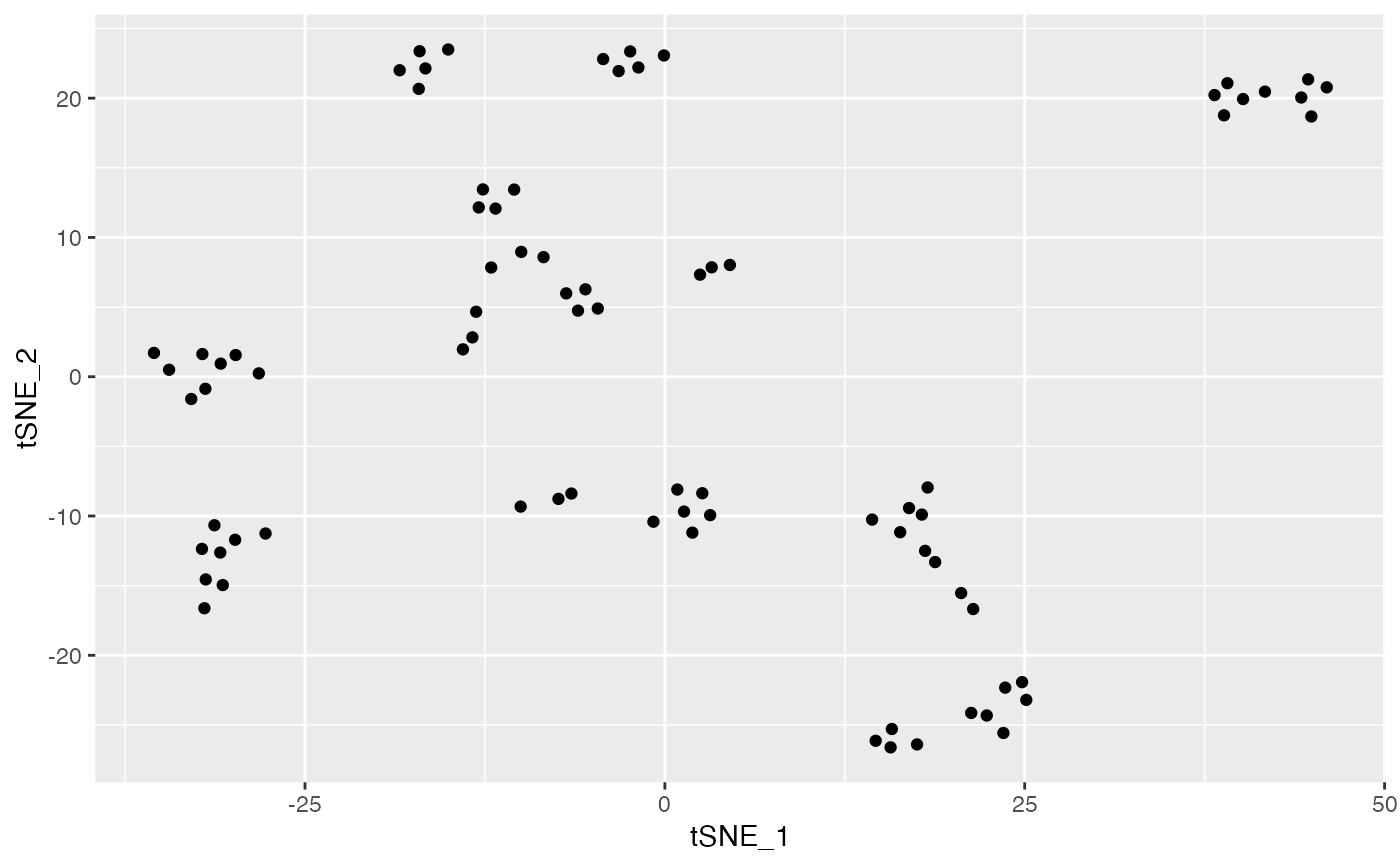
Generate a ggplot plot for
DimReduc objects
# S3 method for DimReduc
autoplot(
  object,
  data = missing_arg(),
  dims = c(1L, 2L),
  na.rm = TRUE,
  show.legend = NA,
  ...
)
Arguments
- object
A
DimReducobject- data
A
data.frame(eg. fromFetchData) with extra data for visualization- dims
Dimensions for visualization
- na.rm
Remove values with
NAs- show.legend
logical. Should this layer be included in the legends?
NA, the default, includes if any aesthetics are mapped.FALSEnever includes, andTRUEalways includes. It can also be a named logical vector to finely select the aesthetics to display.- ...
Arguments passed to
geom_point
Value
A ggplot object
Details
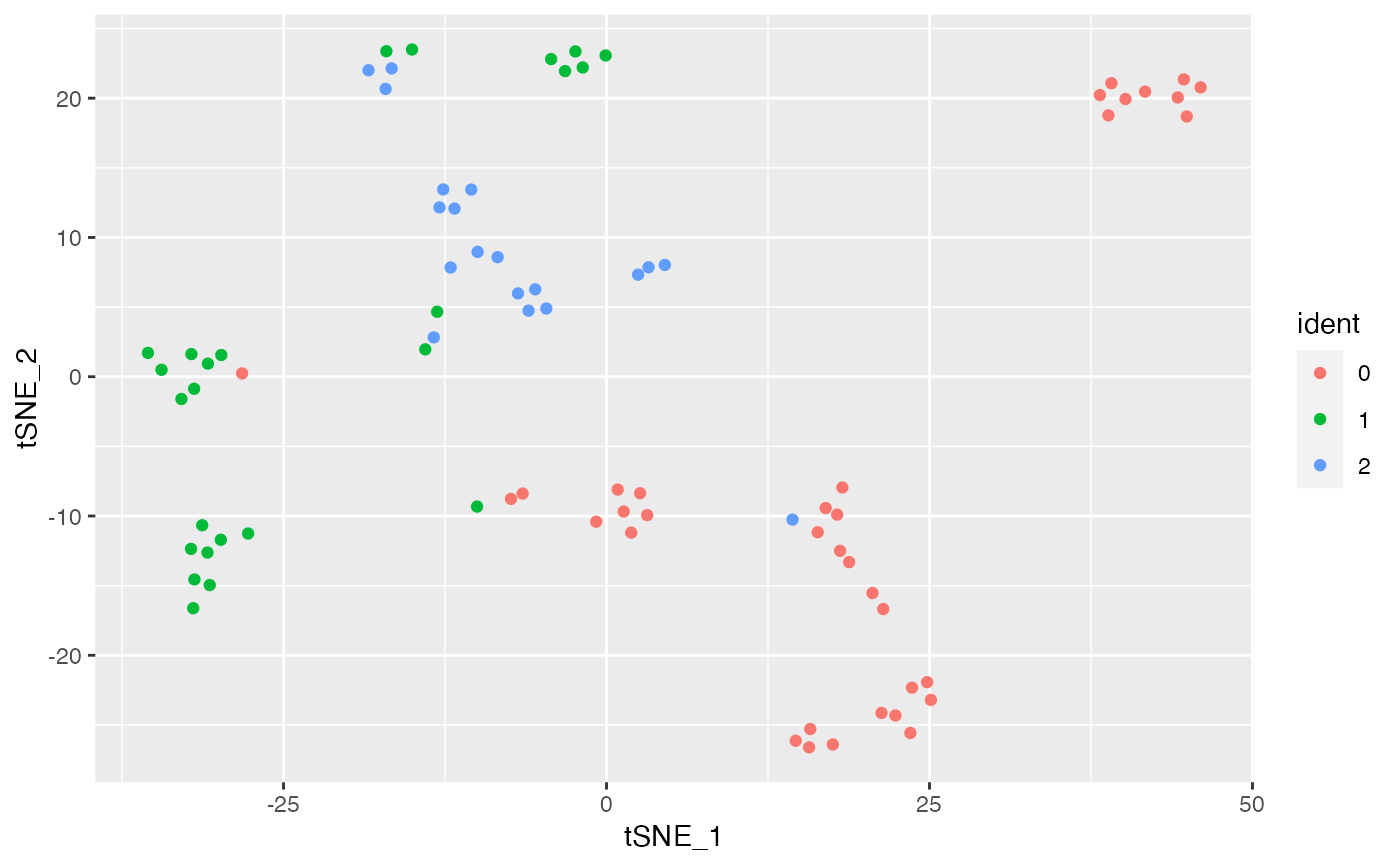
The following aesthetics are mapped automatically:
“
x”“
y”“
color”
See also
Visualize Dimensional Reductions:
autolayer.DimReduc(),
fortify.DimReduc()