Generate a long-format data frame for ease of use with
ggplot(); as a bonus, this method enables direct
calling of Assay objects in
ggplot() (see examples)
# S3 method for Assay
fortify(
  model,
  data,
  features = NULL,
  layer = c("data", "scale.data", "counts"),
  na.rm = FALSE,
  ...
)
Arguments
- model
An
Assayobject- data
A
data.frame(eg. fromFetchData) with extra data for visualization- features
A vector of features to include in the fortified data; defaults to the variable features
- layer
Name of layer to pull expression data for
- na.rm
Remove values with
NAs- ...
Ignored
Value
A long-format data frame for use with ggplot()
Details
fortify.Assay() generates a data frame based on the
expression data stored in layer; automatically creates a column for
cell names (“cell”). Also creates creates a column for
identity classes (“ident”) if not present in data; the
default identity class is
“SeuratProject”
; final column output
order is:
“
cell”“
ident”expression data for
featuresadditional meta data provided by
data
See also
ggplot2::ggplot(),
ggplot2::fortify()
Visualize Assay Expression Data:
autolayer.Assay(),
autoplot.Assay()
Examples
data("pbmc_small")
rna <- pbmc_small[["RNA"]]
md <- FetchData(pbmc_small, vars = "ident")

# Create a data frame for `ggplot()`
df <- fortify(rna, data = md)
head(df)
#>             cell ident     PPBP IGLL5    VDAC3 CD1C AKR1C3 PF4 MYL9     GNLY
#> 1 ATGCCAGAACGACT     0 0.000000     0 0.000000    0      0   0    0 0.000000
#> 2 CATGGCCTGTGCAT     0 0.000000     0 0.000000    0      0   0    0 0.000000
#> 3 GAACCTGATGAACC     0 4.753095     0 0.000000    0      0   0    0 0.000000
#> 4 TGACTGGATTCTCA     0 0.000000     0 4.378773    0      0   0    0 4.378773
#> 5 AGTCAGACTGCACA     0 0.000000     0 0.000000    0      0   0    0 0.000000
#> 6 TCTGATACACGTGT     0 0.000000     0 0.000000    0      0   0    0 0.000000
#>   TREML1 CA2 SDPR PGRMC1 S100A8    TUBB1 HLA-DQA1 PARVB RUFY1 HLA-DPB1
#> 1      0   0    0      0      0 0.000000 0.000000     0     0        0
#> 2      0   0    0      0      0 4.776153 0.000000     0     0        0
#> 3      0   0    0      0      0 0.000000 0.000000     0     0        0
#> 4      0   0    0      0      0 0.000000 4.378773     0     0        0
#> 5      0   0    0      0      0 0.000000 0.000000     0     0        0
#> 6      0   0    0      0      0 0.000000 0.000000     0     0        0
#>   RP11-290F20.3   S100A9
#> 1      0.000000 0.000000
#> 2      0.000000 4.776153
#> 3      4.753095 4.753095
#> 4      0.000000 0.000000
#> 5      0.000000 0.000000
#> 6      0.000000 0.000000
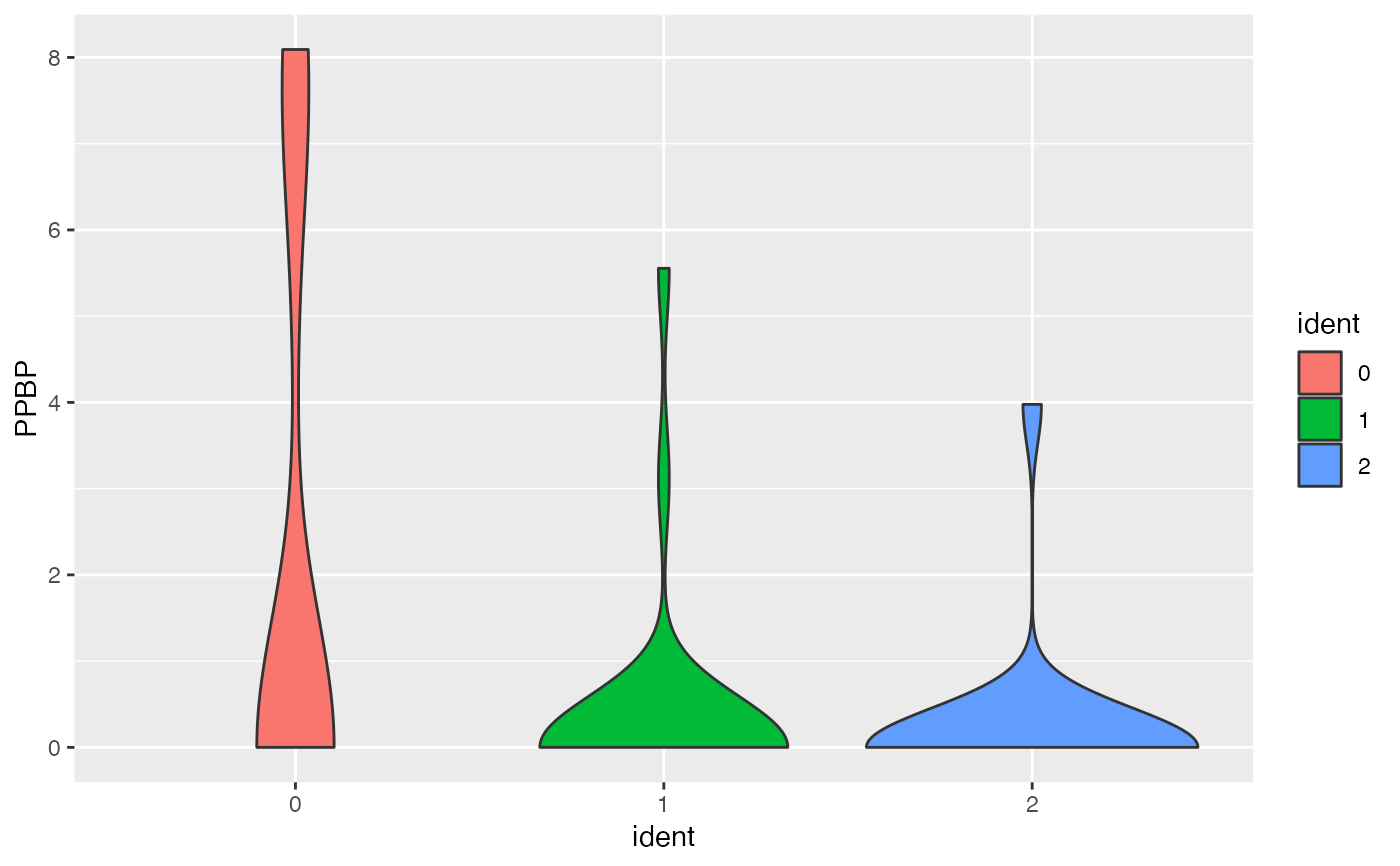
ggplot(df, mapping = aes(x = ident, y = PPBP, fill = ident)) +
  geom_violin()


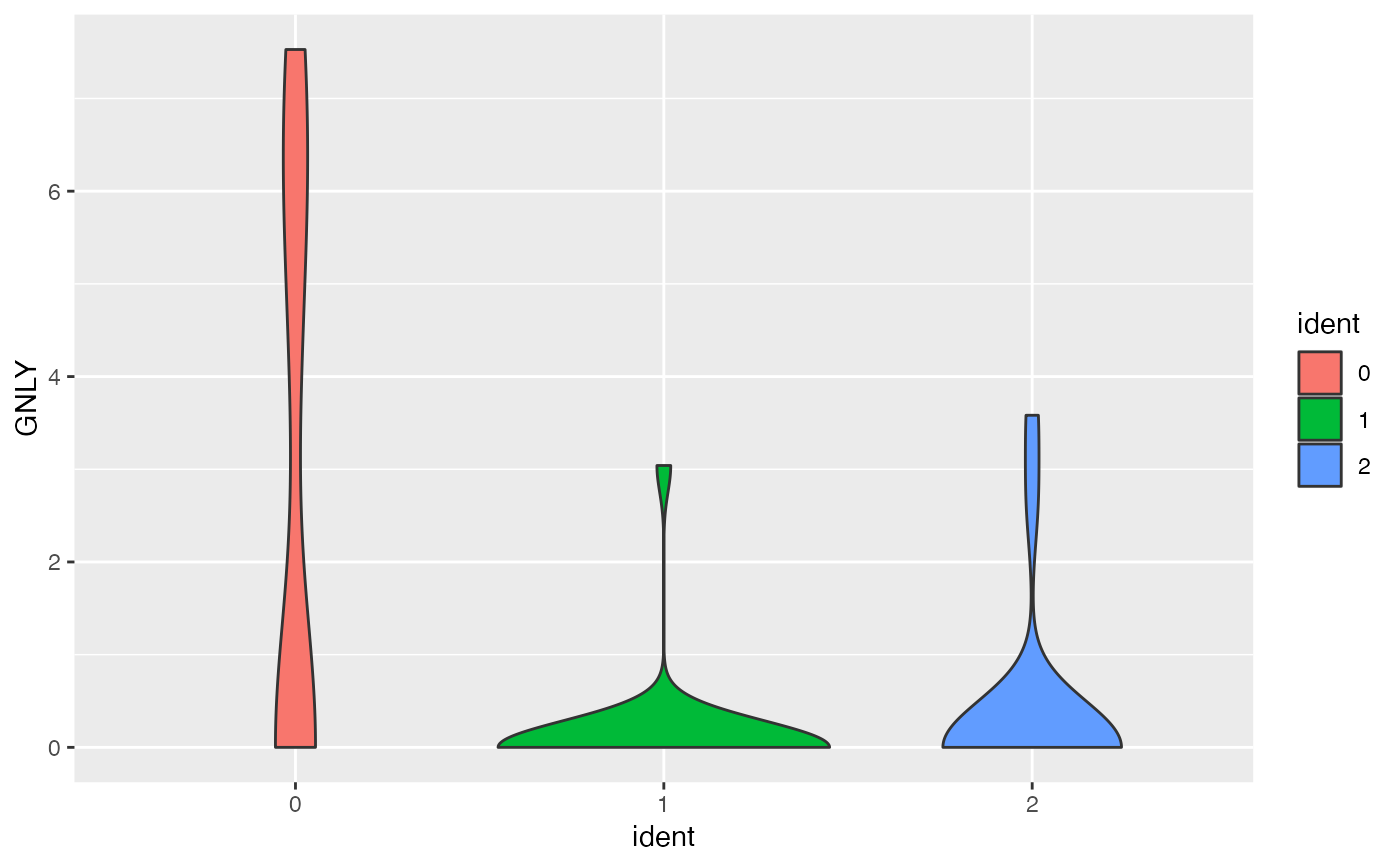
# Use an `Assay` directly in `ggplot()`
ggplot(rna, mapping = aes(x = ident, y = GNLY, fill = ident), md) +
  geom_violin()
